Home Platform

One in-store moment. Every stakeholder served.

A QR scan captures consumer identity, product data and a compliance record at the counter. A dashboard turns those records into intelligence for retailers, recyclers and brands. No hardware. No IT project. Live in four weeks.

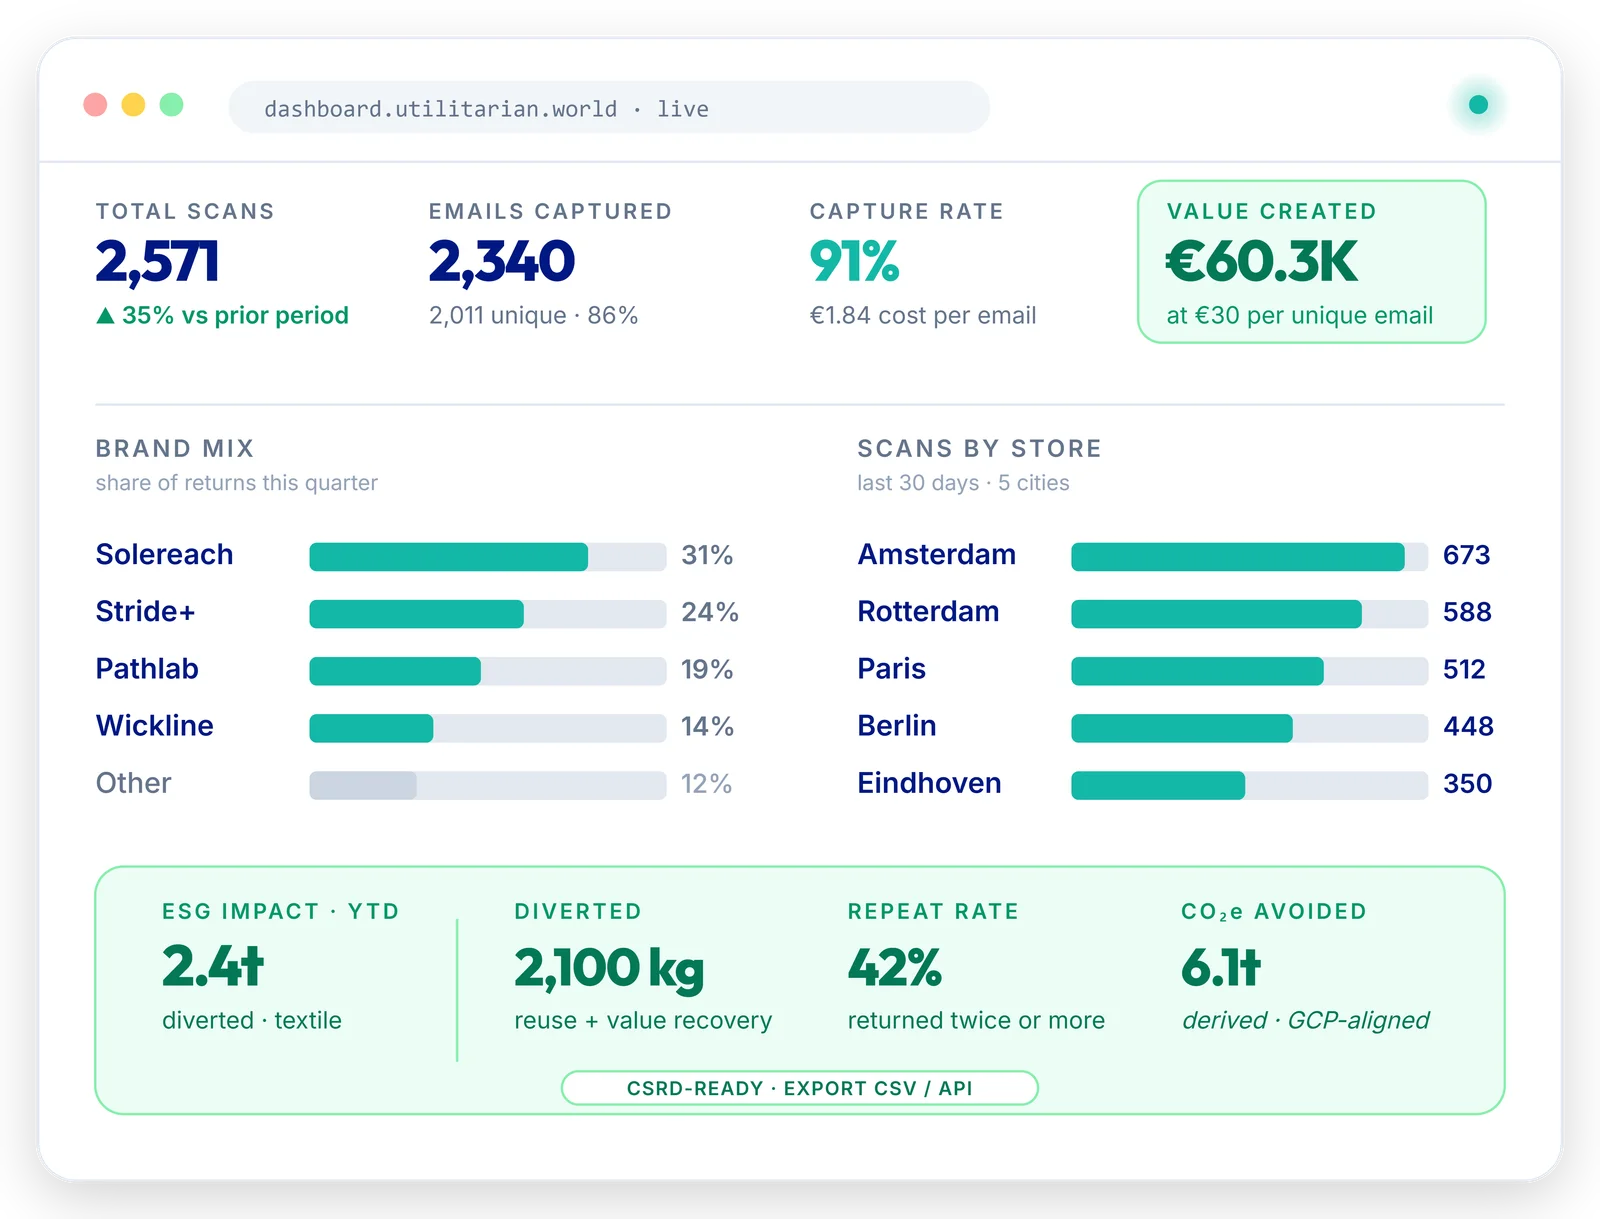
dashboard.utilitarian.world · live Utilitarian dashboard showing live capture rate, brand mix, scans by store and ESG impact across nine stores.
0sec
One scan, one consent, one record. The full interaction at the counter.
0%
Identification accuracy on live deployments. Worn, scuffed, faded products.
0wks
From kickoff to live in store. Branded posters, dashboard, integrations included.
€13
Per verified consumer email, with product data attached. Inclusive of platform fee.
The 20-second moment

A poster, a phone, and a yes.

The customer arrives with a returned product. They scan the QR code on the counter poster. From there, the platform takes over — on their phone, with their consent, and without a single staff interruption.

  1. 01

    Scan the poster.

    One QR code per store. Loads in their browser. No app download, no account.

    0:00
  2. 02

    Photograph the item.

    AI identifies brand, model and category. Works on worn, scuffed and faded.

    0:05
  3. 03

    Confirm and consent.

    Customer reviews what was identified, agrees to receive the reward, gives consent.

    0:12
  4. 04

    Reward issued on screen.

    Discount code or store credit, your choice. Issued instantly. Redeemed at the counter.

    0:17
  5. 05

    Record lands in your CRM.

    Email, product, store, time and outcome. One row, audit-ready, ready to market against.

    0:20
Two surfaces

An app for the counter. A dashboard for the office.

Two products. One source of truth. The same record that issues the reward at the counter is the same record your CRM, your reporting and your recycler will see.

The app

One QR code per store. 20 seconds per customer.

White-label, branded to your retailer. Loads instantly in any modern browser. No app download, no account, no staff training. The customer drives the whole interaction on their own device.

  • Customer-facing, on their own phone
  • AI product identification, human-in-the-loop confirmation
  • Branded screens, configurable reward types
  • GDPR-native consent capture
20sInteraction
92%AI accuracy
0Apps to install
The dashboard

A live record of every take-back, the moment it happens.

Every scan generates a structured record. The dashboard turns those records into store-level, brand-level and category-level intelligence. Three views, one data layer — for retailers, recyclers and brands.

  • Live volume, capture rate and outcome by store
  • Brand and category breakdowns, comparable across retailers
  • CSV export and REST API for CRM and reporting
  • CSRD- and EPR-ready compliance views
3Audience views
€1–3Per email
CSV / APIExport
Product identification

AI that works on returned items.

Returned products are worn, scuffed, faded and out of their box. Off-the-shelf models are trained on pristine marketing photography — the wrong distribution. We trained ours on what customers actually bring back.

92% Identification accuracy on live deployments

Measured against staff-confirmed ground truth across 1,500+ scans in nine Dutch stores. The customer takes a photo. The model proposes brand, model and category. The customer confirms with one tap.

  • Works on worn, scuffed and damaged products
  • Brand and category from a single photo
  • Human-in-the-loop confirmation, never silent
  • No barcode or label scan required
  • Model adapted per retail partner and category
What it captures

Every take-back, a structured record.

Four fields, one row, exportable. Structured for CRM integration, CSRD reporting and EPR compliance — not locked in a proprietary format.

01

Consumer identity

Email captured with explicit opt-in and timestamp. GDPR-compliant, source-tagged, ready for CRM.

02

Product data

Brand, model and category via AI photo recognition. 92% accuracy on returned items.

03

Store & date

Location-stamped. Store-level reporting from day one, no manual reconciliation.

04

Circular outcome

Tracked from consumer handover to recycler. Auditable chain of custody, end to end.

All data exportable via CSV or REST API. Structured for CRM integration, CSRD reporting and EPR compliance. Not locked in a proprietary system.

Who it serves

Three audiences. One 20-second interaction.

The same scan delivers a usable record to three different teams — without duplicating the customer experience or fragmenting the data.

Retailers

A new owned channel at €1–3 per email.

  • Email capture with product data attached
  • Configurable incentive drives repeat visits
  • CRM integration via API or CSV export
  • CSRD and EPR reporting data built in
  • Store-level dashboard with weekly reporting
Recyclers

Visibility before the box arrives.

  • Structured intake data before collection
  • Volume and category tracking by store
  • Automated store-level billing reports
  • Free consumer app for your retail clients
  • One flat fee for all clients and all stores
Brands

See what happens after the sale.

  • Your market share across retail partners
  • Category and product lifecycle data
  • Cross-retailer volume tracking
  • CSRD / EPR-ready compliance data
  • Retail-media layer for brand engagement
Engineered against retail reality

Five things we refused to ask of your store.

Take-back has been a side-of-desk programme for years because the technology asked for things retail can’t give. We engineered the platform against that list.

  • An app for the customer to install
    The QR code loads the interaction in their browser. They never leave the camera.
  • Hardware at the counter
    A printed A4 poster and a Wi-Fi router. The customer’s phone is the device.
  • An IT project to integrate
    Daily CSV out of the dashboard, or a REST endpoint into your CRM. Pick one.
  • Staff retraining
    Staff point at the poster. The customer drives the rest on their own phone.
  • A data risk to manage
    Consent-first capture, EU-hosted infrastructure, audit-ready chain of custody.
From kickoff to live

Four weeks, four meetings, live in store.

One discovery call, three working sessions, branded posters in the window. Most pilots are running before the next quarterly review.

  1. Week 1

    Scope and branding

    Pick the stores, the categories, the reward. Approve the white-label visual treatment.

  2. Week 2

    Dashboard and integration

    Dashboard live, store users provisioned, CRM endpoint or CSV drop configured.

  3. Week 3

    Posters and training

    Counter posters printed and shipped. 20-minute staff briefing per store, recorded.

  4. Week 4

    Live in store

    First scans flowing into your CRM. Weekly review with our team for the first month.

What partners say

Three operators. Nine stores. Six months in market.

We even see customers coming back specifically to hand in their shoes and collect their reward. The system is working very well in terms of building loyalty and repeat visits.
Rowen Slagter-PormesManagement, Runnersworld Hoorn
What makes this data valuable is not just transparency, but control. For the first time, we can link in-store collection directly to operational circular outcomes.
Danny PormesCEO, FastFeetGrinded
The combination of simplicity, customer engagement and data-driven transparency is what makes this approach stand out. This is exactly the direction our industry needs.
Ron BruinenbergRetail & Expansion, EK Netherlands

Twenty minutes. Your deployment plan.

Book a walkthrough. We bring the cost model, the rollout timeline and reference stores you can talk to. You bring the questions.